This is an old revision of the document!
Table of Contents
Metric To Fit Signal To Line
Overview
This command can be used to fit a signal to a line. Y = mX + b and create Metrics for Slope (a), Intercept (b), Sigma m, Sigma b, CHI2, and Q (R^2)
It can be found within the Pipeline Workshop under Metric.
Pipeline Command
The syntax for the function is as follows:
Metric_To_Fit_Signal_To_Line
! /RESULT_METRIC_FOLDER=PROCESSED
/RESULT_METRIC_NAME=
/SIGNAL_TYPES=
! /SIGNAL_FOLDER=ORIGINAL
! /SIGNAL_NAMES=
/SIGNAL_COMPONENTS=
/X_SIGNAL_TYPE=FRAME_NUMBERS
! /X_SIGNAL_FOLDER=ORIGINAL
! /X_SIGNAL_NAME=TIME
/X_SIGNAL_COMPONENT=0
! /EVENT_SEQUENCE=
! /EXCLUDE_EVENTS=
! /GENERATE_MEAN_AND_STDDEV=FALSE
! /APPEND_TO_EXISTING_VALUES=FALSE
;
Command Parameters
The following table shows the command parameters seen above and their descriptions:
| /RESULT_METRIC_NAME= | The resulting name of the metric |
| /RESULT_METRIC_FOLDER= | The resulting folder of the metric |
| /SIGNAL_TYPES= | The type of signal to be processed |
| /SIGNAL_NAMES= | The name of the signal to be processed |
| /SIGNAL_FOLDER | The folder of the signal to be processed |
| /SIGNAL_COMPONENT= | The component of the signal to be processed |
| /X_SIGNAL_TYPE= | The signal type for the independent variable |
| /X_SIGNAL_NAME= | The signal name for the independent variable |
| /X_SIGNAL_FOLDER= | The signal folder for the independent variable |
| /X_SIGNAL_COMPONENT= | The signal component for the independent variable |
| /GENERATE_MEAN_AND_STDDEV= | Calculate the mean and standard deviation |
| /APPEND_TO_EXISTING_VALUES= | Append values to the existing result signal |
Dialog
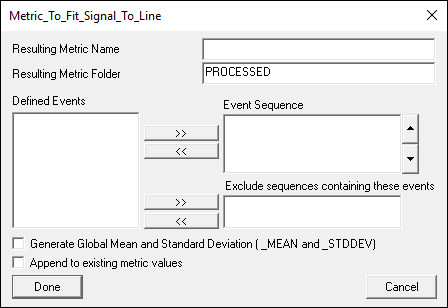
The command can be edited in a text editor or in a dialog form. To edit in the dialog pop up form either click on the Edit button in the pipeline workshop or double-click on the pipeline command. The dialog is shown below.
The dialog box allows you to assign values to the command parameters outlined above.
Example Tracking Pelvis Position While Walking
Here, Metric To Fit Signal To Line is used to track the horizontal position of the pelvis during a gait trial and identify the linearity of its movement.
The pipeline command is as follows:
Metric_To_Fit_Signal_To_Line
/RESULT_METRIC_FOLDER=PROCESSED
/RESULT_METRIC_NAME=Pelvic_position_line
/SIGNAL_TYPES=KINETIC_KINEMATIC
/SIGNAL_FOLDER=RPV
/SIGNAL_NAMES=CGPos
/SIGNAL_COMPONENTS=Y
/X_SIGNAL_TYPE=FRAME_NUMBERS
! /X_SIGNAL_FOLDER=ORIGINAL
! /X_SIGNAL_NAME=TIME
/X_SIGNAL_COMPONENT=0
! /EVENT_SEQUENCE=
! /EXCLUDE_EVENTS=
! /GENERATE_MEAN_AND_STDDEV=FALSE
! /APPEND_TO_EXISTING_VALUES=FALSE
;
This command states that the Y (in this case Y is the walking direction) position of the CG of the subject's pelvis will be used to compute a linear equation that best matches the movement of the pelvis during this trial.
Results
The resulting signal includes 6 components:
1: Slope = 1.295153 2: Intercept = -0.487144 3: Slope Uncertainty = 0.002145 4: Intercept Uncertainty = 0.001587 5: Chi2 = 0.008558 6: R^2 Statistic = 0.999851
The R^2 statistic indicates how closely the linear equation models the dataset. The closer the R^2 value is to 1 the more linear of a relationship present in the data. Here the pelvis cg position follows an almost perfectly linear trajectory.
Notes
The resulting signal has 6 components:
Slope = m → Component 1
Intercept = b → Component 2
Siga = uncertainty in m → Component 3
Sigb = uncertainty in b → Component 4
Chi2 = chi square → Component 5
Q = The R^2 statistic → Component 6
Legacy Parameters
Prior to Visual3Dv5.02.28:
1. The EVENT_SEQUENCE was defined only using a start/end event. This meant if there were multiple sequences, Visual3D would return NO_DATA. The original event names were:
/START_EVENT= /END_EVENT= 2. It was not possible to calculate the mean/standard deviation or append values
In version 6 these parameters are converted into an Event Sequence.


