This is an old revision of the document!
Table of Contents
Metric Interquartile
Overview
The Metric Interquartile command is used to find the range of the middle 50% of datapoints within a set. A quartile is a statistical measure that divides a data set into four equal parts, with each part representing 25% of the observations. There are three quartile values: the first quartile (Q1), which marks the 25th percentile; the second quartile (Q2), which is the median; and the third quartile (Q3), which marks the 75th percentile. The interquartile range can be defined as Q3-Q1 and can be helpful when analyzing the variability of data and/or identifying outliers.
Read more here.
Pipeline Command
The command can be found in the Pipeline Workshop under Metric as so:
Metric_Interquartile
! /RESULT_METRIC_FOLDER=PROCESSED
/RESULT_METRIC_NAME=
! /APPLY_AS_SUFFIX_TO_SIGNAL_NAME=FALSE
/SIGNAL_TYPES=
! /SIGNAL_FOLDER=ORIGINAL
! /SIGNAL_NAMES=
! /COMPONENT_SEQUENCE=
/EVENT_SEQUENCE=
/EXCLUDE_EVENTS=
! /GENERATE_MEAN_AND_STDDEV=TRUE
! /GENERATE_MEAN_AND_STDDEV_ACROSS_SUBJECTS=FALSE
! /APPEND_TO_EXISTING_VALUES=FALSE
;
Command Parameters
The following table shows the command parameters seen above and their descriptions:
| RESULT_METRIC_FOLDER | The name of the result signal folder |
| RESULT_METRIC_NAME | The name of the result signal |
| APPLY_AS_SUFFIX_TO_SIGNAL_NAME | Specify the metric name to be the ORIGINAL signal plus a SUFFIX |
| SIGNAL_TYPES | Specify the signal type |
| SIGNAL_FOLDER | Specify the origin folder |
| SIGNAL_NAMES | Specify the Signal to be used |
| COMPONENT_SEQUENCE | Specify the Signal components to be used (e.g. X + Y + Z or 0 + 1 + 2 etc) |
| EVENT_SEQUENCE | A list of events (separated by “+” signs). For example, LHS+RTO |
| EXCLUDE_EVENTS | If this event occurs before the first and last event, do not computed a metric |
| GENERATE_MEAN_AND_STDDEV | Generate the mean and standard deviation of this metric |
| GENERATE_MEAN_AND_STDDEV_ACROSS_SUBJECTS | Generate the mean and standard deviation of this metric across ranges and files |
| APPEND_TO_EXISTING_VALUES | Add these metric values to an existing metric |
Dialog
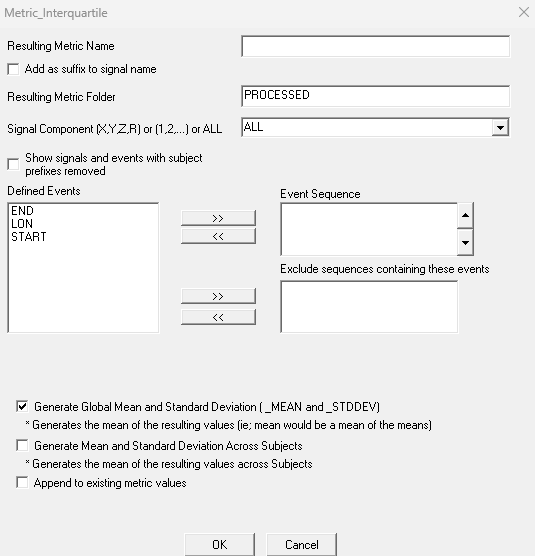
The command can be edited in a text editor or in a dialog form. To edit in the dialog pop up form either click on the Edit button in the pipeline workshop or double-click on the pipeline command. The dialog is shown below
The dialog box allows you to assign values to the command parameters outlined above.
Example: COFP Range for balance trial
Here the Metric Interquartile command is used to analyze center of foot pressure data during a standing trial and compare the ranges computed for a subject's left and right sides.
The command for the right side looks like this:
Metric_Interquartile
! /RESULT_METRIC_FOLDER=PROCESSED
/RESULT_METRIC_NAME=COFP_RIGHT_INTER
! /APPLY_AS_SUFFIX_TO_SIGNAL_NAME=FALSE
/SIGNAL_TYPES=COFP
! /SIGNAL_FOLDER=ORIGINAL
/SIGNAL_NAMES=FP3
 /COMPONENT_SEQUENCE=ALL
/EVENT_SEQUENCE=START+END
/EXCLUDE_EVENTS=
! /GENERATE_MEAN_AND_STDDEV=TRUE
! /GENERATE_MEAN_AND_STDDEV_ACROSS_SUBJECTS=FALSE
! /APPEND_TO_EXISTING_VALUES=FALSE
;
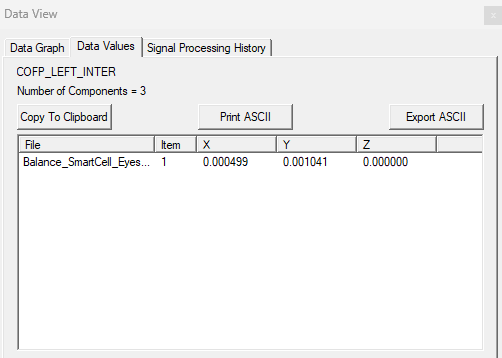
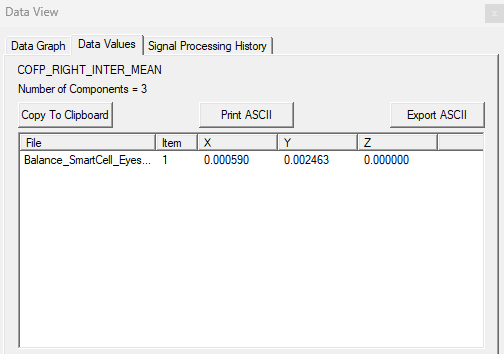
COFP is a 2 dimensional signal, with the X and y components representing the medial/lateral and anterior/posterior directions respectively. The resulting metrics contain an x value and a y value indicating the variation in pressure for each direction during the trial. A larger range indicates greater variation in the COFP value during the trial and a less consistent balance point.
The results for this trial show a larger range for the right side than left and a greater range in the Y direction than X for both sides.


