Table of Contents
Using Principal Component Analysis in Biomechanics
Sift provides a number of ways to visualize and interact with the results of PCA. An overview of all PCA visualizations can be found in Sift - Analyse Page. More detail on the mathematics behind PCA can be found on our page: The Math of Principal Component Analysis (PCA).
This page includes:
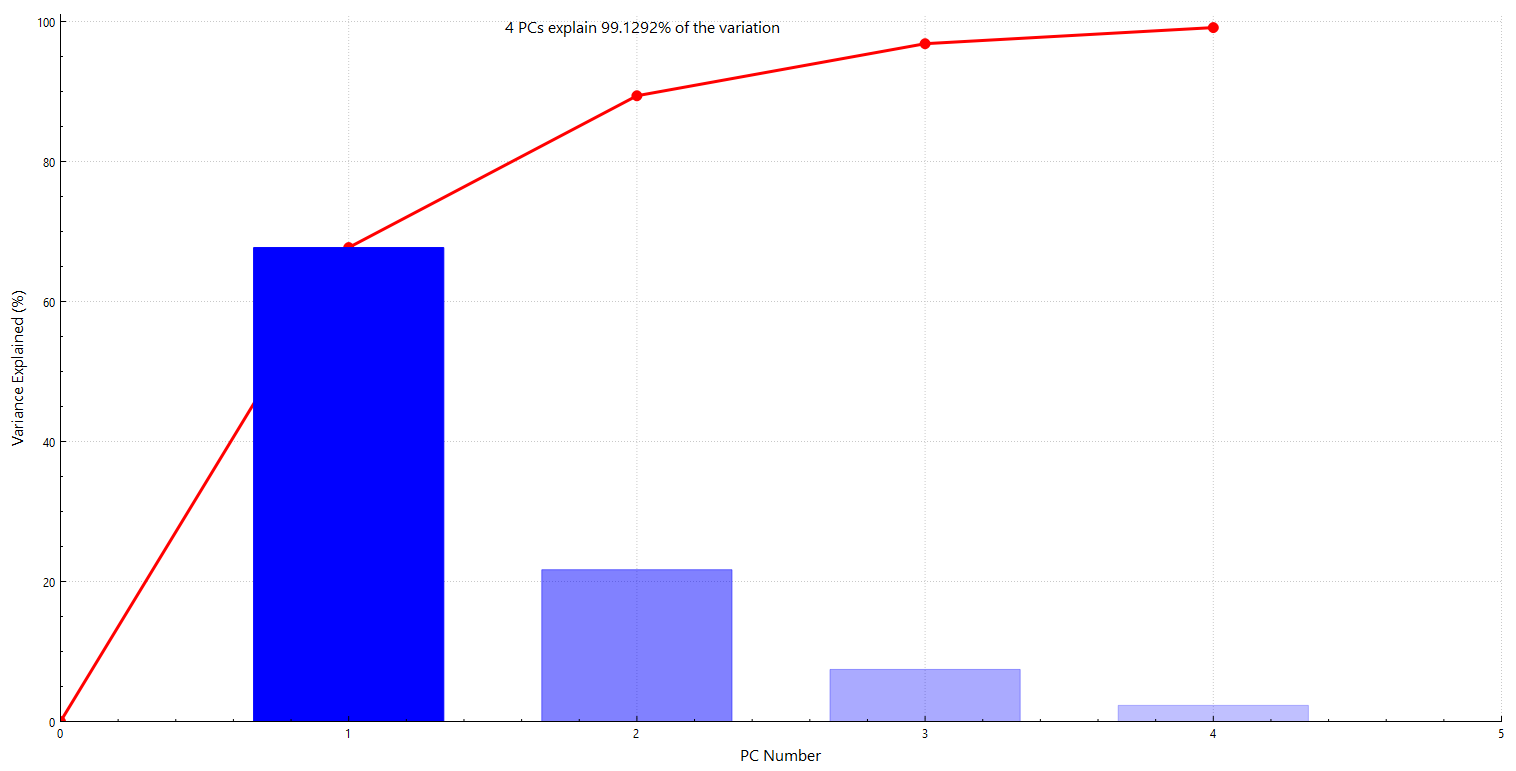
- Visualizing the variance explained by each PC individually;
- Visualizing the variance explained by each PC at each point in the signal's cycle;
- Scatter-plotting workspace scores in PC-space;
- Showing the distribution of scores by group for each PC;
- Visualizing the mean and extreme values that result from reconstructing the underlying data with each PC; and
- Visualizing how the signals can be reconstructed from the computed PCs.
Further Analysis
Sift has several built in modules to take you further with you PCA Analysis:
- Outlier Detection for PCA: An overview of the PCA outlier detection methods built into Sift.
- Mahalanobis Distances: Finding outliers through their Mahalanobis Distances.
- Squared Prediction Error: Finding outliers through their SPE.
- Local Outlier Factors: Finding outliers through the Local Outlier Factor.
- K-Means Analysis: Clustering PCA results through K-Means clustering.
Tutorials
For a step-by-step example of how to use Sift to perform PCA on your data, see the PCA Tutorial.
For a step-by-step example of how to use Sift to perform further k-means clustering on PCA results, see the Tutorial: Run K-Means.
For a step-by-step example of how to use Sift to perform outlier analysis on PCA results, see the Tutorial: Run PCA Outlier Analysis.
For a step-by-step example of processing and analyzing large data sets in Sift and using PCA to distinguish between groups, see the Tutorial: Treadmill Walking In Healthy Individuals and the Tutorial: Analysis of Baseball Hitters.
