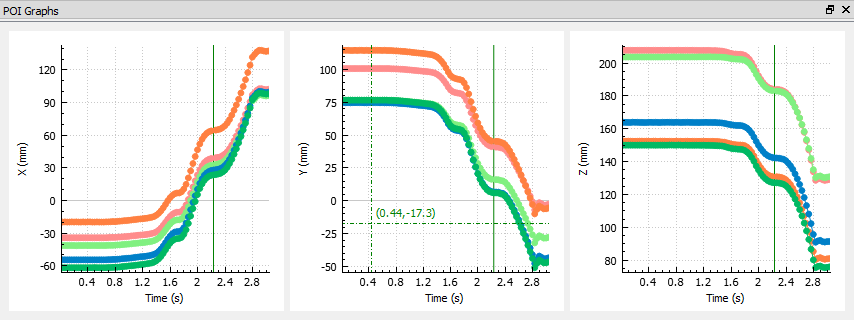
POI Graphs
The POI Graphs widget displays graphs of the X, Y, and Z coordinates of the selected POIs for the current trial.
As the cursor is moved around the graph a crosshair shows the current coordinates. If the cursor is close enough to one of the data points for a POI it will snap to it and display that point's coordinates in the POI's color.
- To move the view of a graph in the Y direction, press the left mouse button and drag the cursor up or down.
- The mouse wheel can also be used to zoom the graph in the Y direction.
- Press the R key to reset the graph to the default view.
- The X axis of the graphs cannot be changed.
Data points cannot be added or moved via the graphs, but they can be deleted. To select one or more points, press the Ctrl key and then box-select them (hold the left mouse button down while sweeping the diagonal of a box with the cursor). Press the Delete key to delete the points. Press the Esc key to deselect them.
See Also
Go back to the Locate3D Overview.
